An ode to my dashboards
A love letter to the hundreds of dashboards I built, tested and shared over thirteen years — anonymized, and gathered here into a single wall.
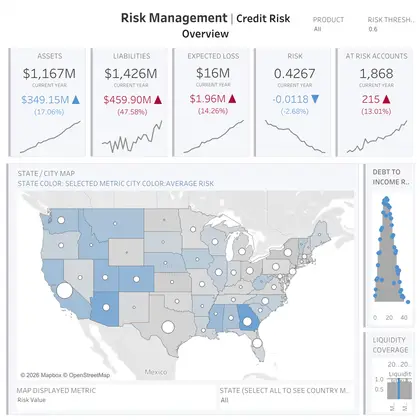
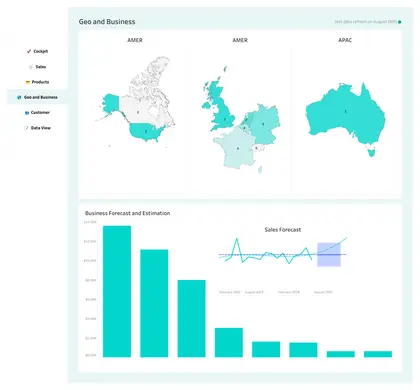
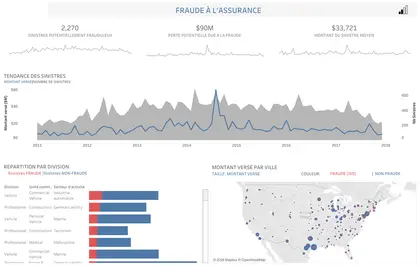
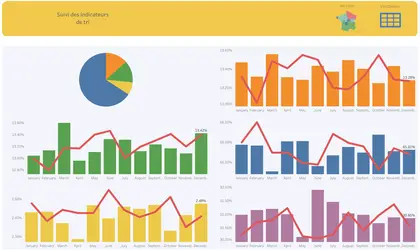
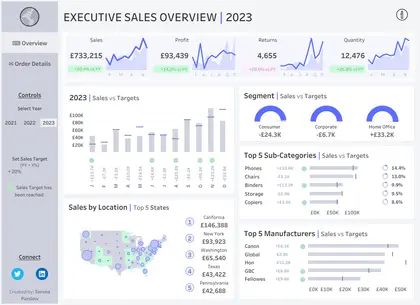
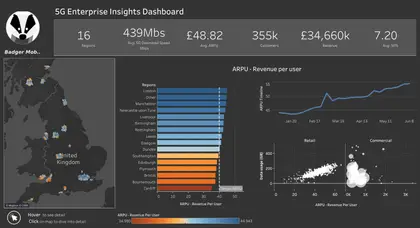
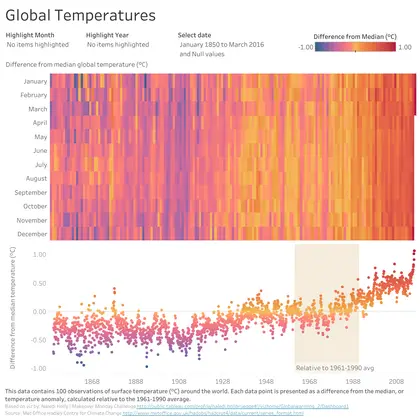
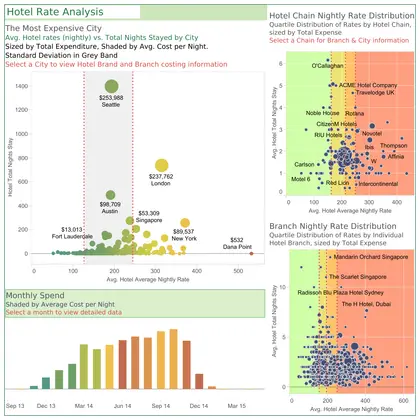
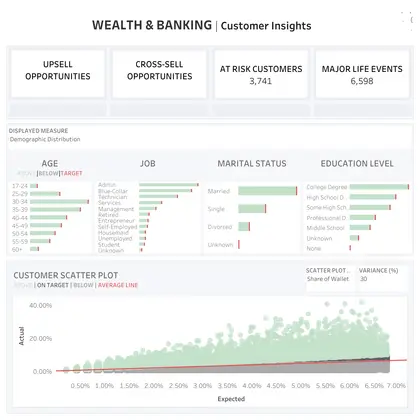
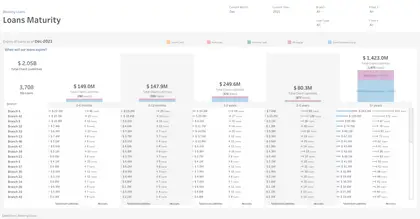
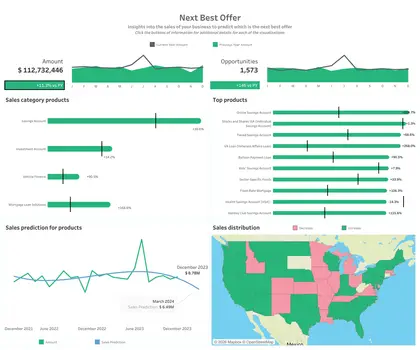
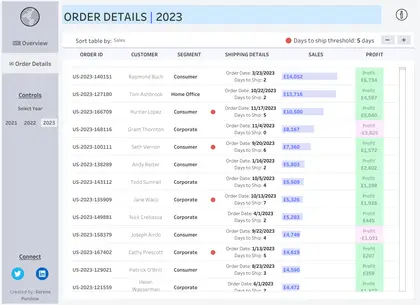
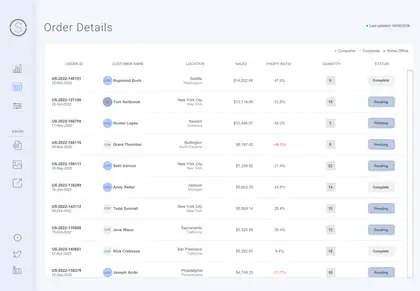
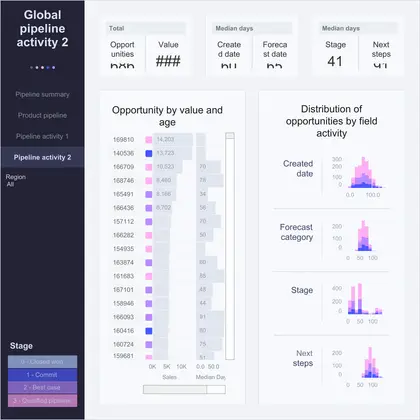
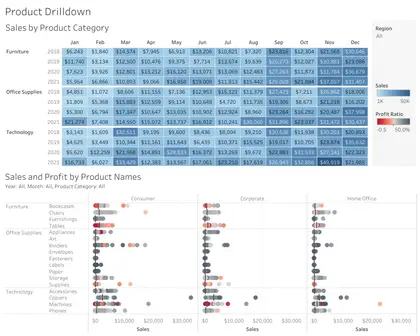
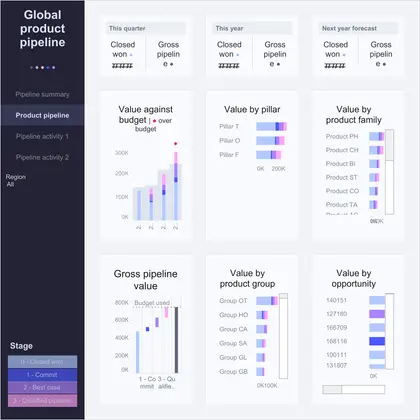
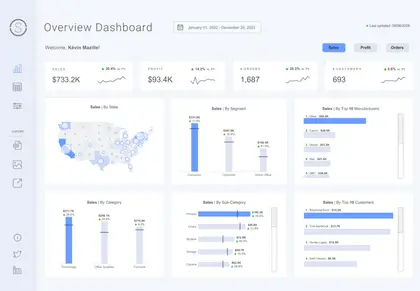
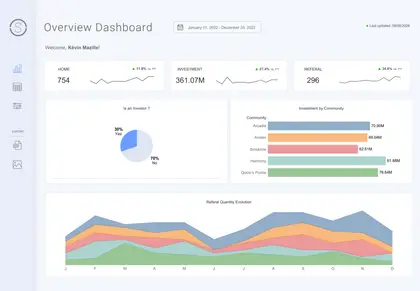
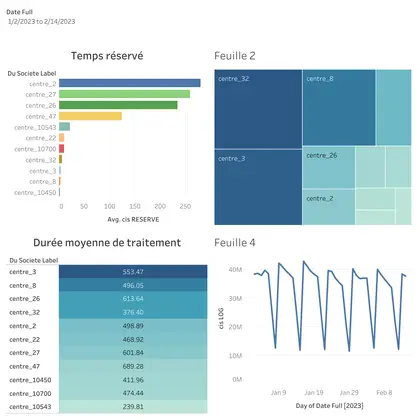
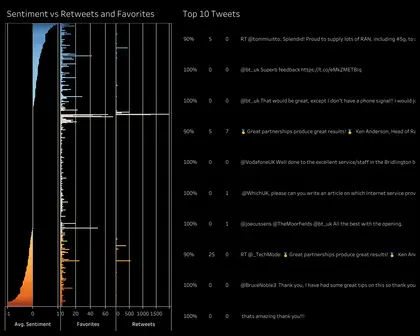
I’ve been building dashboards for almost thirteen years. I started with SAS Visual Analytics, a long time ago now; I dabbled in Microsoft Power BI, leaned heavily on Tableau, and reached for other tools whenever a project called for it. Do that long enough and you end up with hundreds of them.
Right now I’m spring-cleaning my employee Tableau site — the place where I’ve piled up demos, POCs and experiments for years. I even built a little tool to make the cleanup more efficient. But before hitting “delete,” I realized I didn’t want to wipe it all without one last look.
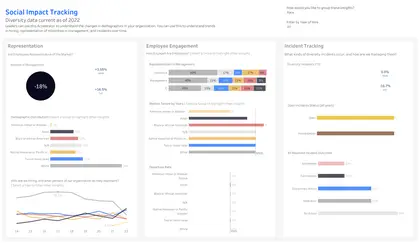
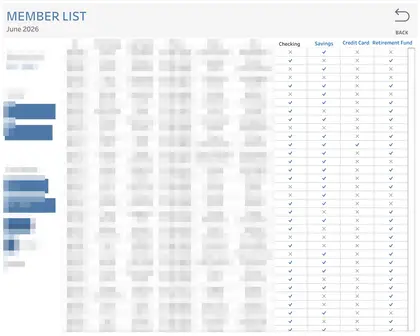
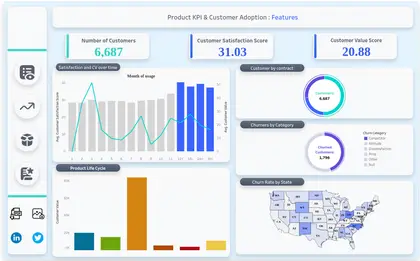
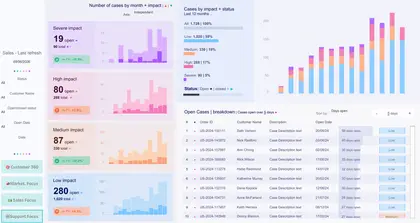
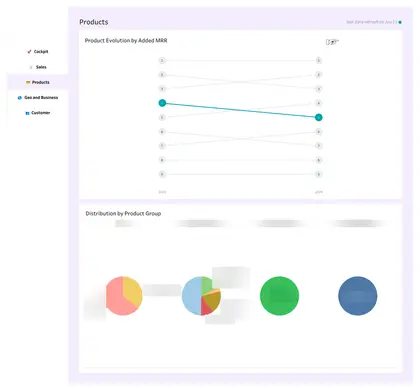
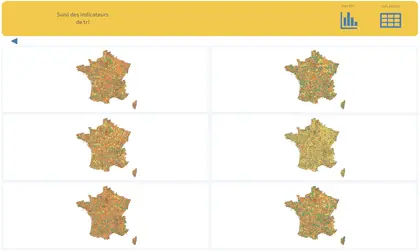
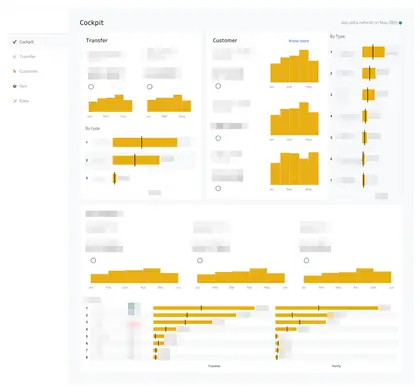
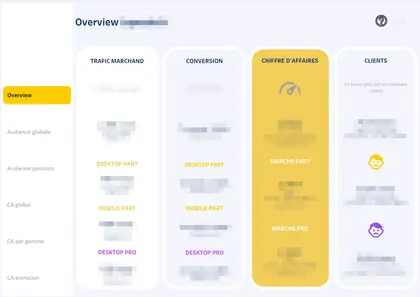
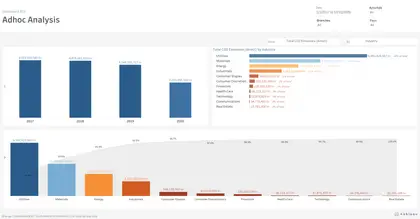
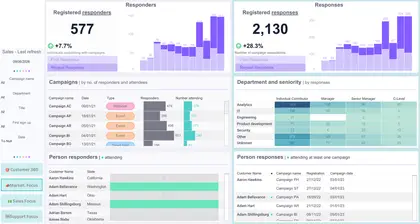
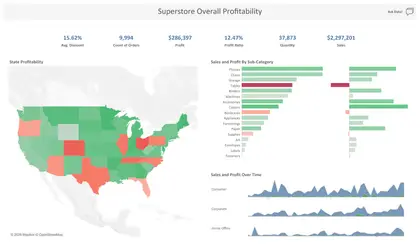
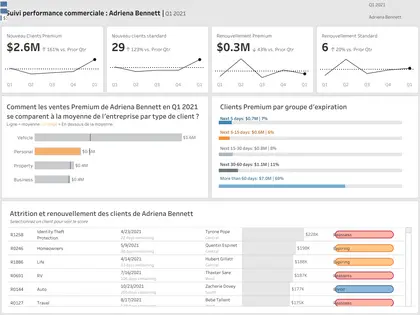
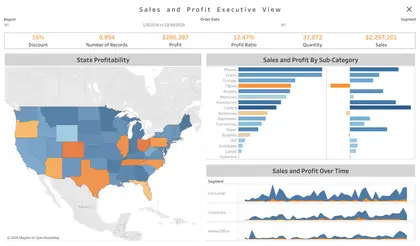
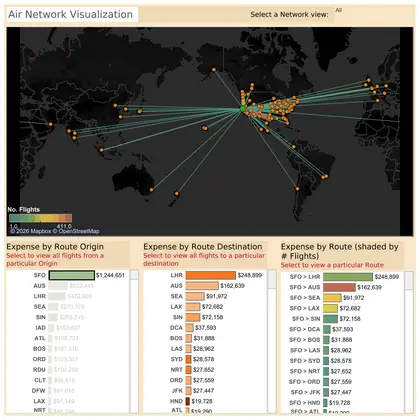
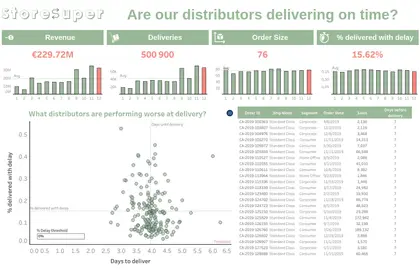
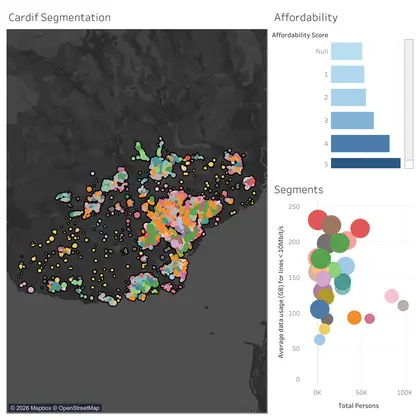
So here’s an ode. A love letter to these dashboards — most of them more demo than anything else, seen by a handful of clients, never shipped to production. All anonymized, trimmed down to a few examples. This wall is what taught me my craft: test, break, start over, and become — I think — fairly good at it.
I didn’t want to lose them. If I ever find myself opening Tableau a little less often, at least I’ll have kept this — to remember.